Full Workflow: Estimate Gene Expression Entropy
Aryan Kamal, Charles Dussiau, Judith Zaugg
30 April 2025
workflow.RmdThis vignette demonstrates a complete example of how to use the
Entropy package to compute entropy values for cells in a
Seurat object.
📦 Load libraries and data
## Loading required package: SeuratObject## Loading required package: sp##
## Attaching package: 'SeuratObject'## The following objects are masked from 'package:base':
##
## intersect, t
data("pbmc_small")
DefaultAssay(pbmc_small) <- "RNA"
result <- run_entropy(
  seu = pbmc_small,
  assay = "RNA",
  nn_list = NULL,           # Automatically computes neighbors
  output_path = NULL,       # Don’t save the full matrix for now
  add_assay = TRUE          # Add entropy matrix as a new assay
)
## INFO [2025-04-30 12:02:05] Starting entropy estimation for assay: RNA
## INFO [2025-04-30 12:02:05] Input Seurat object contains 80 cells and 230 features
## INFO [2025-04-30 12:02:05] Assay 'RNA' found and set as default assay.
## INFO [2025-04-30 12:02:05] No neighbor list provided. Computing neighbors using PCA reduction.## Computing nearest neighbors## Only one graph name supplied, storing nearest-neighbor graph only## INFO [2025-04-30 12:02:05] Reading the precomputed table
## INFO [2025-04-30 12:02:10] Entropy matrix added to Seurat object as 'RNA_entropy'.
# Check the added assay
result[["RNA_entropy"]]
## Assay data with 230 features for 80 cells
## First 10 features:
## MS4A1, CD79B, CD79A, HLA-DRA, TCL1A, HLA-DQB1, HVCN1, HLA-DMB, LTB,
## LINC00926
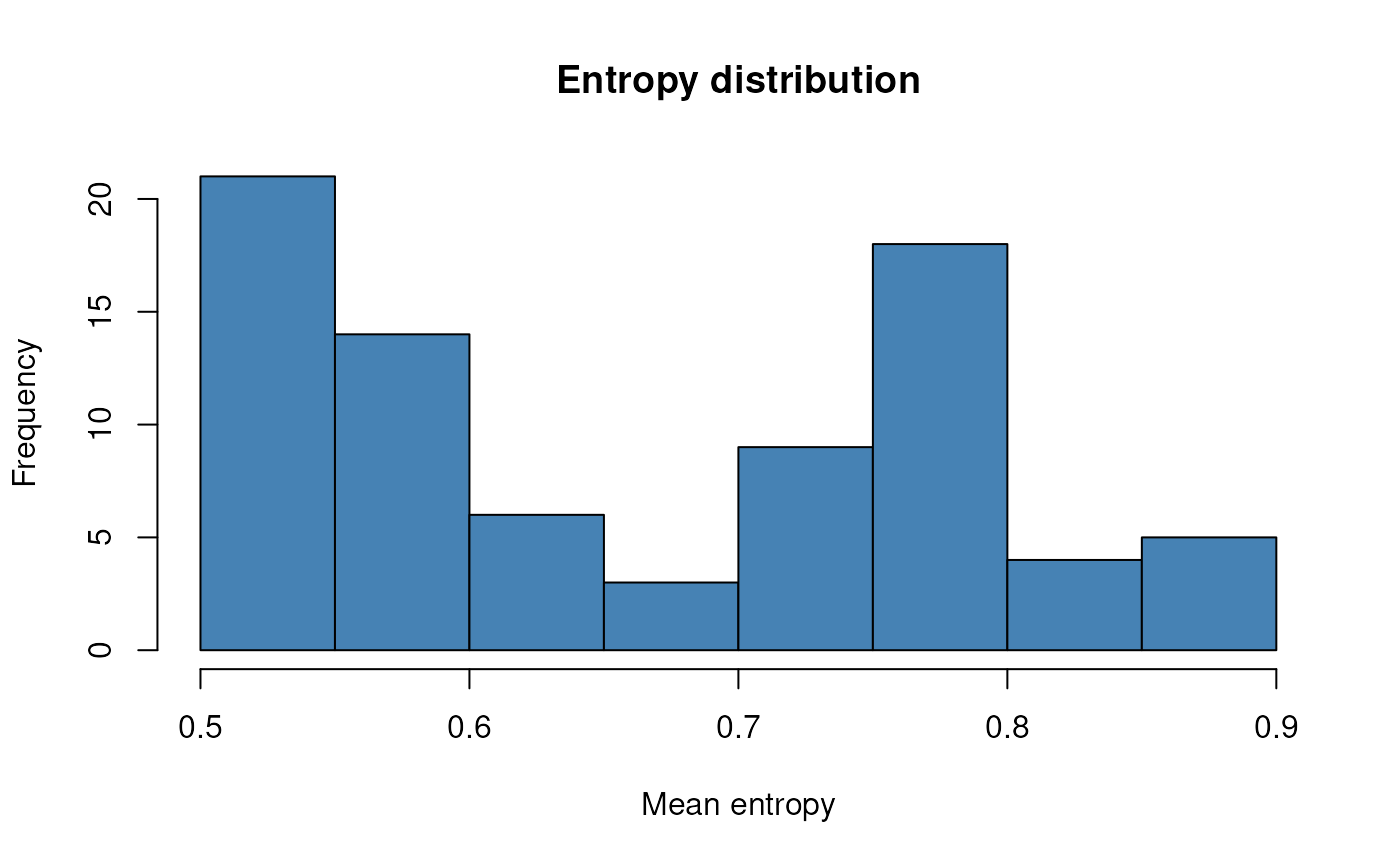
# Visualize mean entropy per cell
means <- colMeans(GetAssayData(result[["RNA_entropy"]]))
hist(means, main = "Entropy distribution", xlab = "Mean entropy", col = "steelblue")